Simulator & Debugger
The extension provides two distinct ways to test your DSP logic without needing hardware connected: the highly interactive Pedal Simulator, and the low-level Debugger.
Pedal Simulator
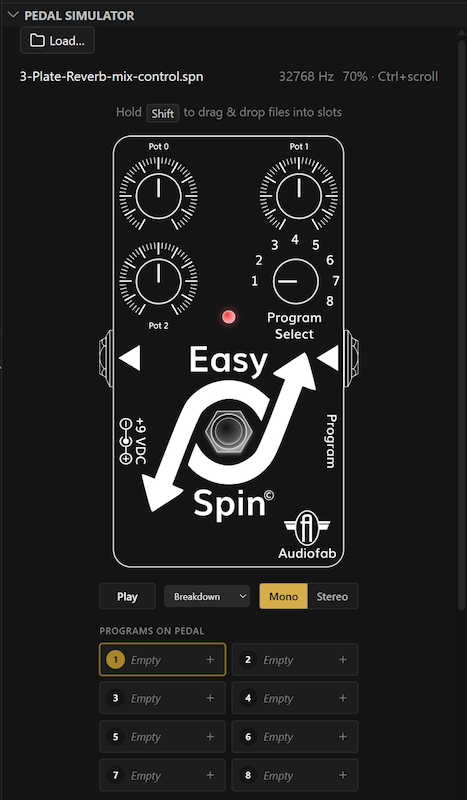
The Pedal Simulator provides a user-friendly, interactive 3D pedal interface based on the easy-spin-ui framework. This allows you to test your effects with the exact look and feel of the physical Easy Spin hardware.
Key Features
Real-time Audio Monitor
Hear your effect in real-time. Use the Audio Monitor panel to select your input source. You can choose from built-in test audio files optimized for different testing scenarios, or supply your own WAV files.
Interactive Controls
The simulator provides real-time, drag-and-drop control of POT0, POT1, and POT2 right on the virtual pedal. You can also click the footswitch to toggle the Bypass state, ensuring your effect behaves correctly across its full parameter range.
Program Bank Management
The Pedal Simulator also serves as your visual bank editor. You can drag and drop .spn or .spndiagram files into any of the 8 slots to build out a program bank (.spnbank file), then program them all to the pedal in one go.
How to Use the Simulator
Open the Command Palette (
Ctrl+Shift+P) and select “FV-1: Open Pedal Simulator”.Select an audio source and click the pedal footswitch to enable the effect.
Low-Level Debugging
For advanced troubleshooting, the old simulator interface is preserved as the Debugger. It integrates with the VS Code debug infrastructure and provides deep access to internal variables and signals.
Key Features
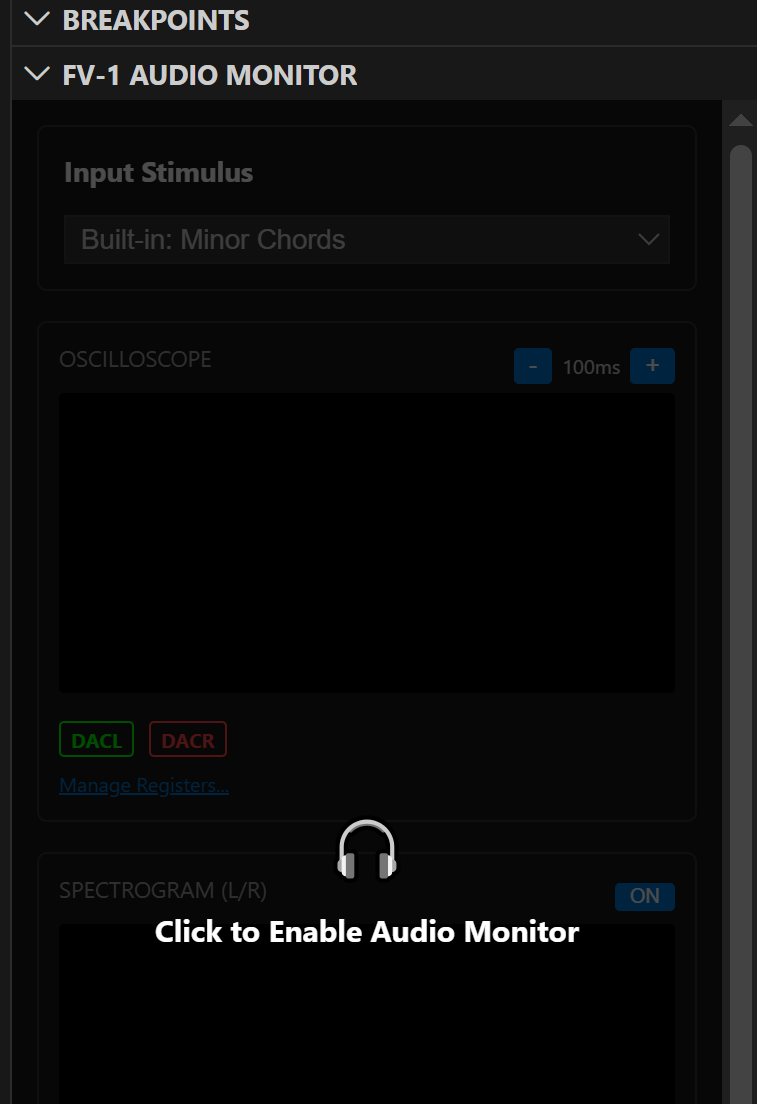
Multi-trace Oscilloscope & Visualizations
Visualize any register or symbol with logarithmic zoom (ranging from 1ms to 1s). The oscilloscope allows you to inspect the accumulator, hardware POTs, and internal registers simultaneously.
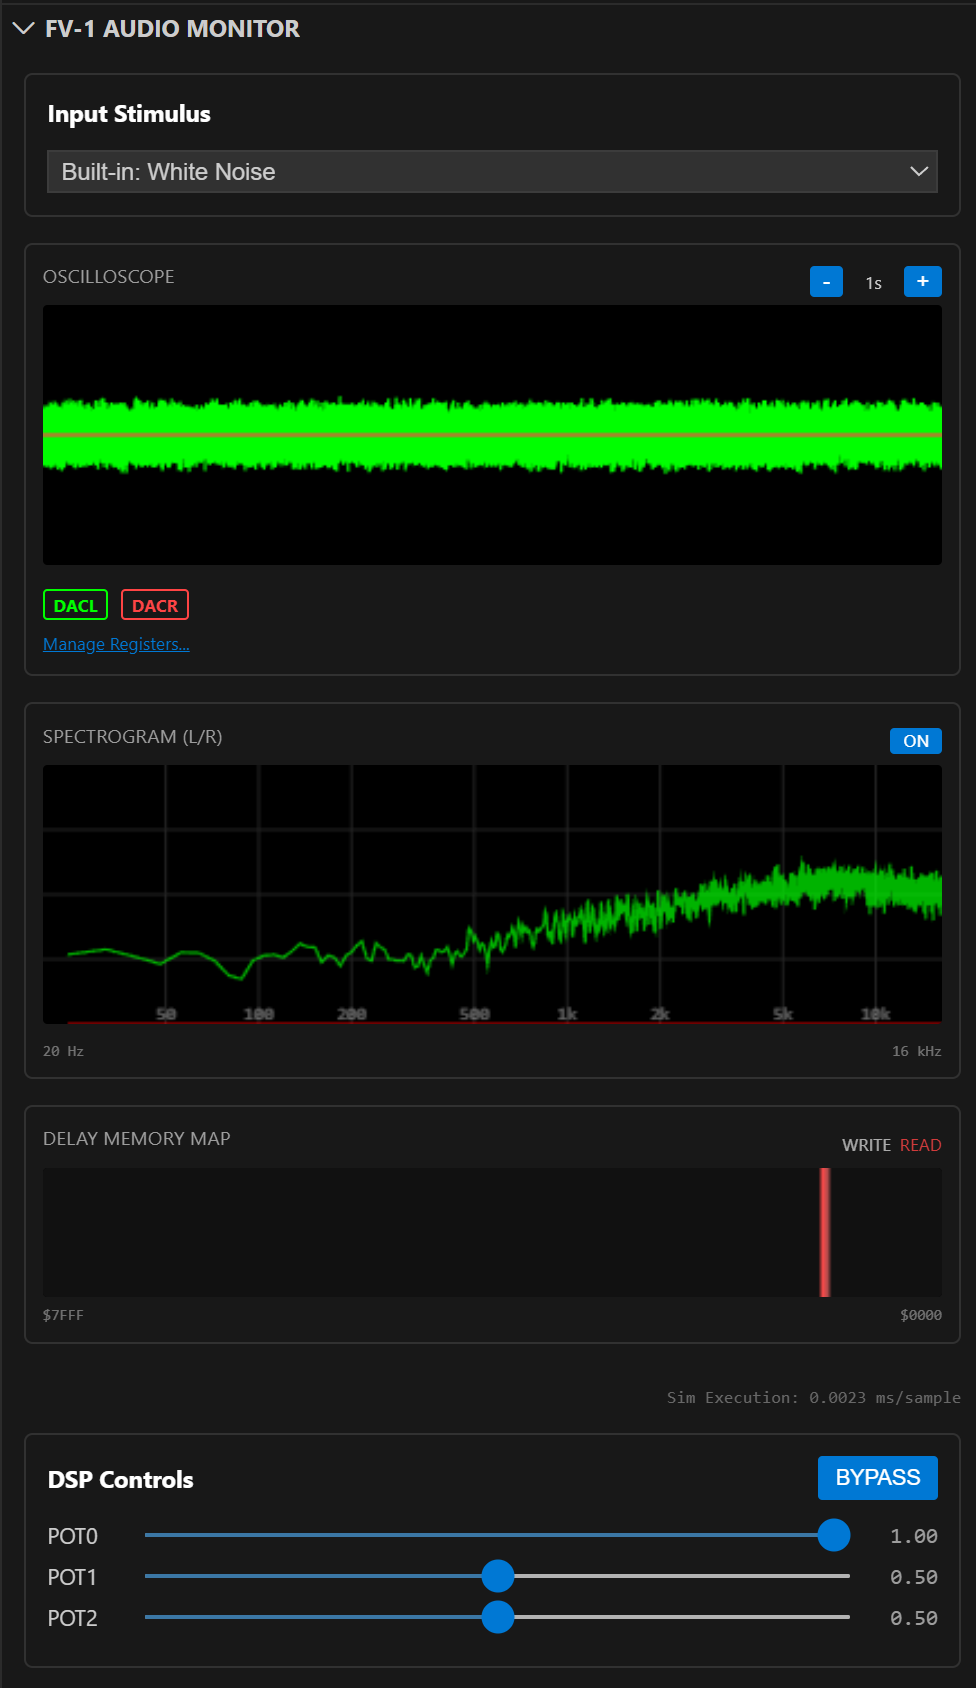
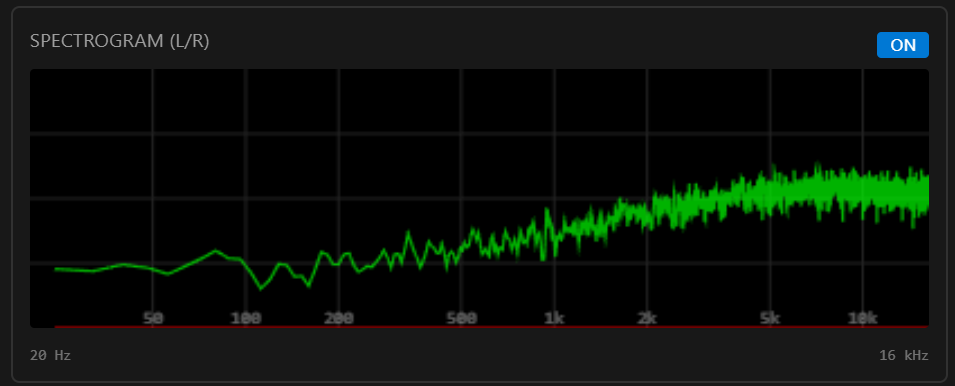
Additionally, the Spectrogram view provides a frequency-domain representation of your signal.
Memory Visualization
The Delay Memory view provides a live map of the 32k-word delay RAM.
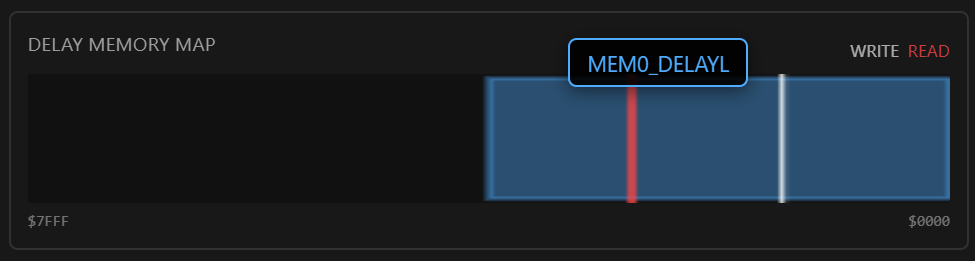
It shows the current read/write pointers and how your program is utilizing delay memory in real-time.
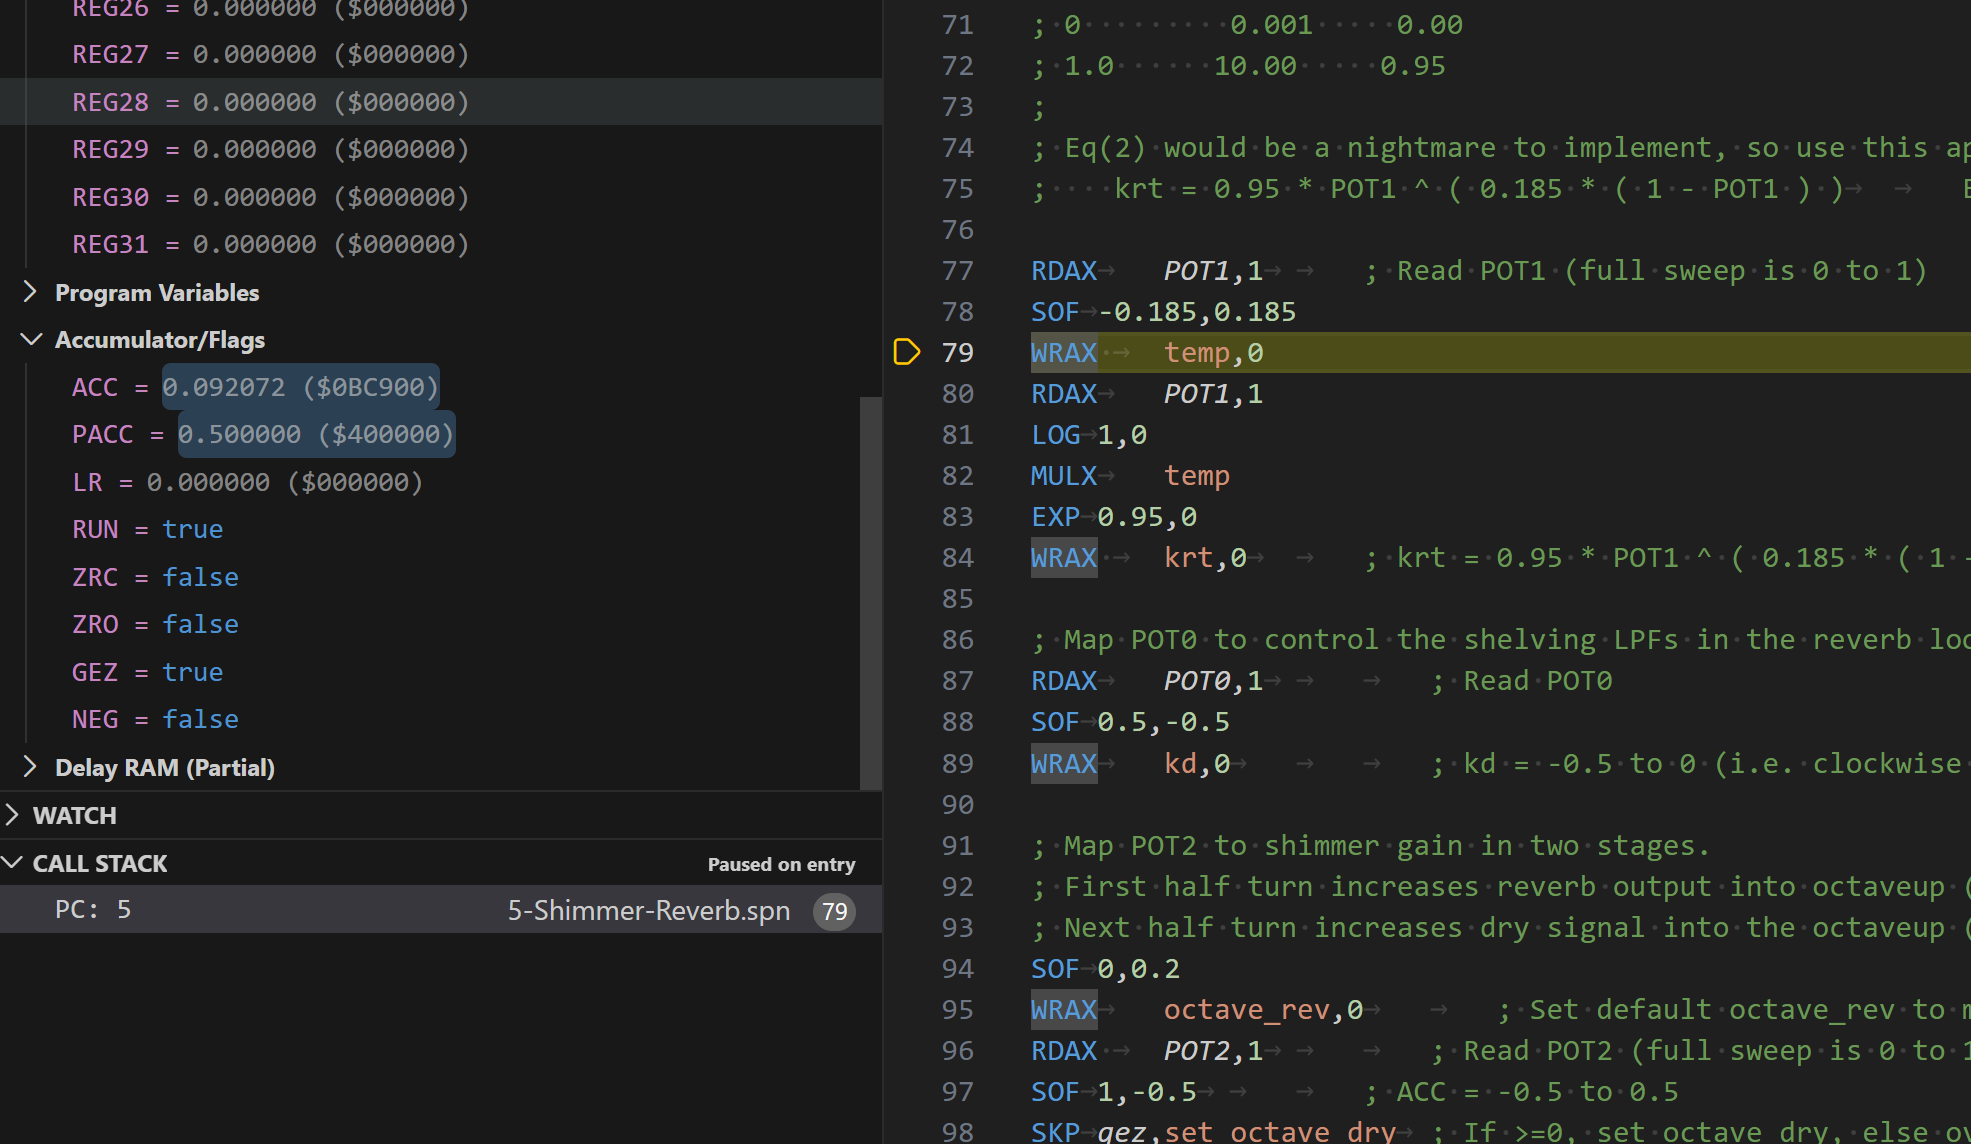
Step-through Debugging
Set breakpoints in your assembly code or visual diagram and step through your program instruction-by-instruction. While paused, you can inspect the exact state of all 32 registers, the accumulator, and the LFOs.
Interactive Controls
The debugger provides real-time control of POT0, POT1, and POT2 via sliders in the UI. You can also toggle the Bypass state to compare your processed signal with the dry input, ensuring your effect behaves correctly across its full parameter range.
How to Use the Debugger
Open a block diagram (
.spndiagram) or assembly file (.spn).Press
Ctrl+Shift+Pand select “FV-1: Launch Debugger” (or pressF5).The VS Code debug view will open and the program will be stopped on the first instruction.
Click the panel to enable audio monitoring and visualizations…
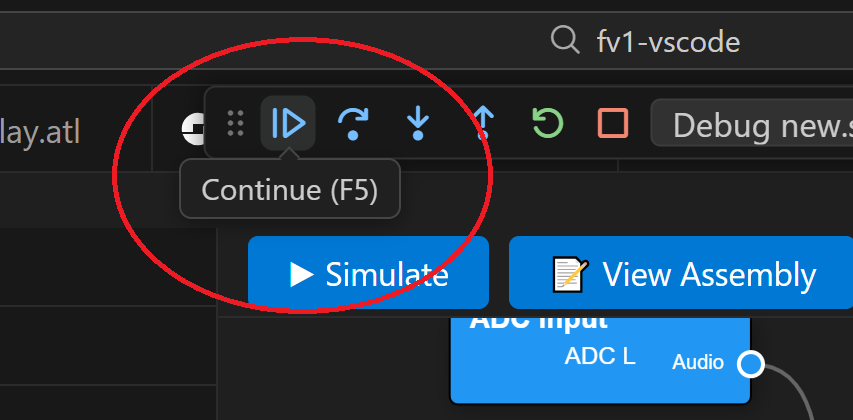
…then click the “Continue (F5)” button to begin debugging.
Tip
Always test your designs using both the Pedal Simulator and the Debugger before programming to hardware to ensure logic correctness and avoid unexpected behavior.